Pipeline Current Mapping (PCM) Survey Cathodic Protection (CP) is applied to buried steel pipelines to complement the protection provided by pipe coating. If the coating is damaged, causing holidays, or if there is an electrical contact between the pipeline and another metal structure, the CP current must be increased to compensate for the resulting losses. Note that this is not achievable using Sacrificial Anode Cathodic Protection (SACP).
Excessive current can be detrimental to the pipe. Therefore, the engineer responsible for the pipeline integrity must achieve a fine balance between effective protection and acceptable current consumption.
If the current becomes excessive, the cathodic protection is ineffective, or a new pipeline has been constructed, and the coating quality needs to be assessed. The pipeline must be surveyed to locate all major faults.
The Pipe Current Mapper has been specifically designed to perform this function and is covered under ANSI/NACE SP0502 “Pipeline External Corrosion Direct Assessment Methodology“.
1. Shortcomings Of Other Techniques
A brief description of the shortcomings of commonly used traditional methods of surveying for pipeline current faults is detailed below :
1.1 The Line Drop Method
The potential gradient between two access points is measured, and the current is derived through calculation. This method is lengthy, complicated, and costly and presents a significant risk of error in measurements and calculations.
1.2 The Pearson Method
Two electrodes are placed on the ground to detect the fault current. This method is personnel-intensive and impractical in very dry soil conditions; it does not measure current losses, so it cannot differentiate between minor and major faults.
1.3 The Current Gradient Method
A traditional pipe locator detects an AC (typically 1 kHz) applied to the pipeline. Large signal losses are assumed to be due to large faults. The losses are also due to capacitance losses along the pipeline, so the natural decay of the signal very often masks faults. This current does not exactly mirror the CP DC. The effect can be particularly misleading at pipeline branches. Capacitance losses also limit the length of pipelines surveyed in one operation.
2. Pipeline Current Mapping Survey: Benefits of Using The PCM Equipment
The PCM has been designed for the pipeline industry with support from Gas Industry leaders. It addresses problems associated with traditional methods of pipeline surveying by providing the following benefits:
- An accurate method of evaluating and mapping cathodic protection current losses.
- The current magnitude and direction measurements are made above the surface without connections to the ground or pipe.
- Near DC signal closely mirrors the CP current.
- For use in all weather and ground conditions.
- One-person operation.
- Indication of fault magnitude, hence avoiding unnecessary and costly excavations.
- The high-powered transmitter enables analysis from one injection point to the next.
- The transmitter can be powered by 220V or batteries, so it is flexible.
- Integral data logging.
- USB interface allows data to be uploaded for graphical representation of records on site.
- GPS compatibility.
- An A-Frame (ACVG) accessory for accurately pinpointing and sizing coating defects
3. Pipeline Current Mapping Survey: General Operation and Equipment
The PCM has been designed to overcome the shortcomings of the existing techniques and now provides pipeline engineers with an accurate, cost-effective product that can be used in all weather and ground conditions. An extremely low, “near DC” frequency (4 Hz) mirrors the DC generated by the cathodic protection as closely as possible. It also avoids signal losses caused by capacitance, so nearly all the signal loss is due to coating faults or shorts to other structures. Conventional pipe locators cannot practically detect such a low frequency, so the receiver is fitted with a precision, high-performance magnetometer. This detects and measures the 4 Hz magnetic field. Advanced signal processing techniques filter and amplify the signal so that push-button current measurements (magnitude and direction) of the “near DC” signal can be made. Integral data logging functions enable storing this data to plot the current loss versus distance.
Figure 1: Typical PCM Transmitter Setup at TRU
The PCM system’s high-powered transmitter makes long-range signal detection up to 15 km possible. Therefore, fewer hookups are required. The transmitter’s flexible power requirements enable it to utilize the variety of supplies available. The transmitter has been designed to be compatible with both distribution and transmission networks. The hand-held receiver unit first locates the pipeline, even in heavily congested areas, and then provides the operator with a measurement of the current magnitude and direction of the near DC signal as applied by the system’s transmitter.
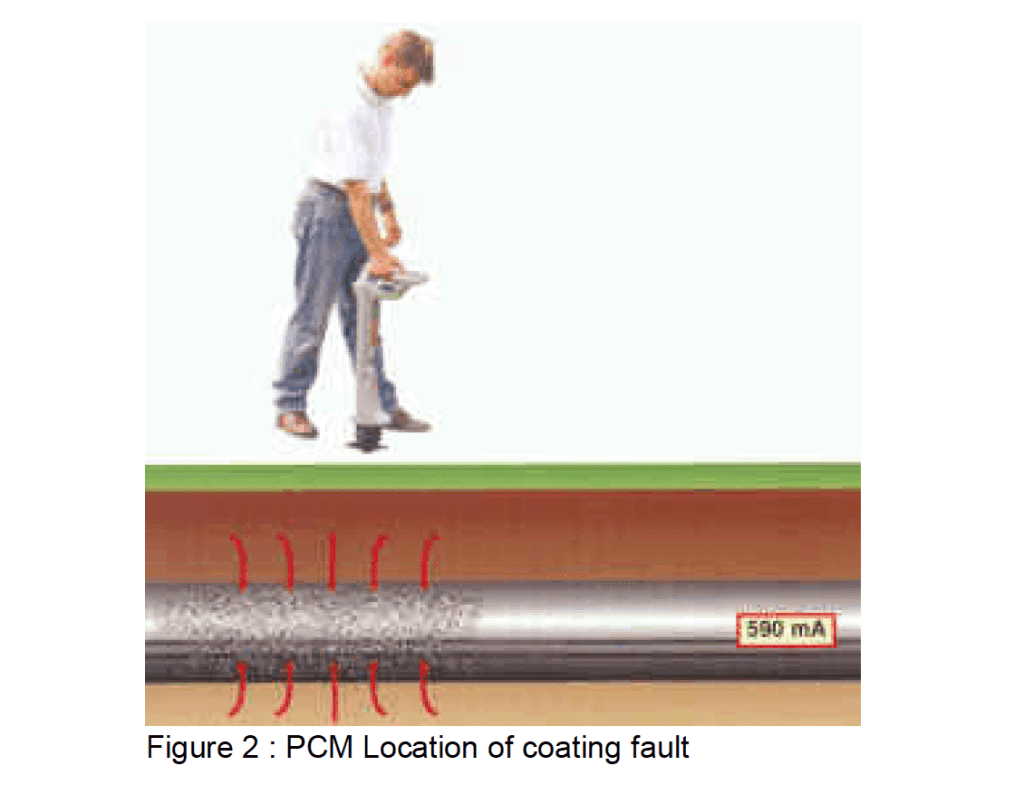
The receiver makes the required calculations and displays the results with a single button press. The measurement can be stored in the integral catalogue with a further button press. This provides the operator with a method for quickly troubleshooting the CP system by pinpointing metallic contacts and locating areas of coating defects, as detailed in Figure 2 below. Additional cable location modes allow the unit to be used as a traditional cable and pipe locator.

Figure 2: PCM Location of coating fault
PCM Attachment (magfoot) contains the magnetometer (mag foot) that detects the near DC mapping current. The PCM magnetometer foot is switched on when the PCM current key is pressed for a PCM measurement. When the PCM foot is fitted to the PCM receiver, there will be a confirming “beep” from the loudspeaker. The PCM magfoot also stores the pipeline’s current mapping results in the built-in data logger, and it must be attached to the receiver to upload results to a PC.
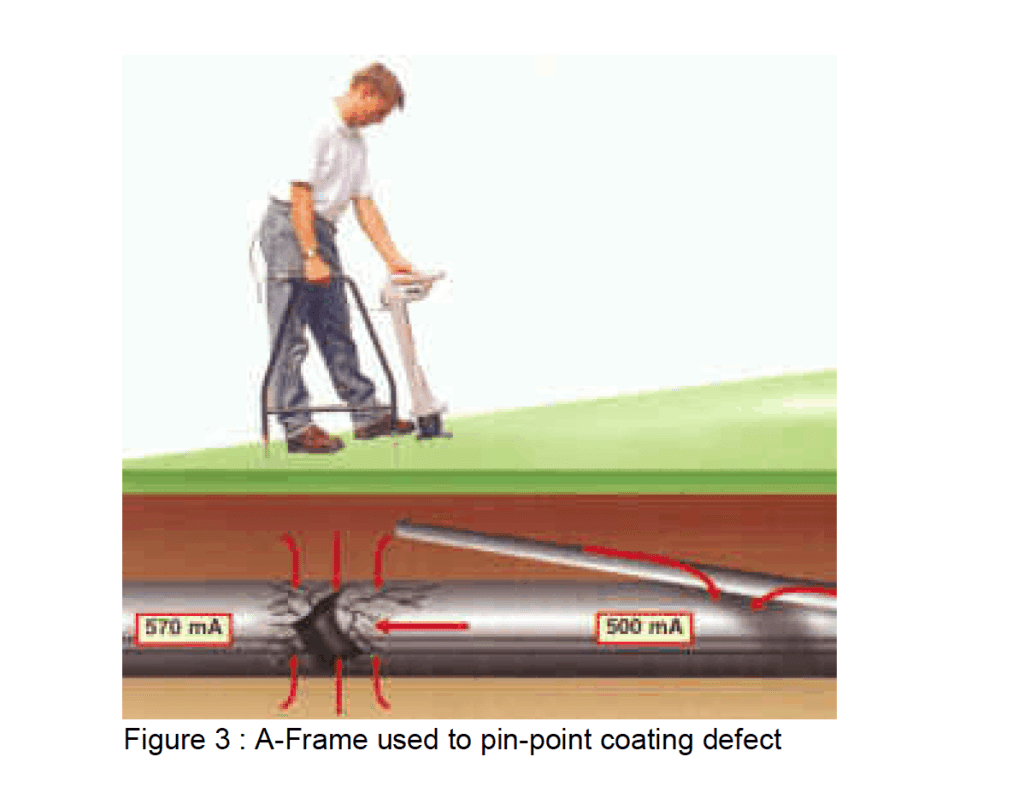
Careful use of the PCM will give the location of coating faults within just a few metres. The addition of the A-Frame attachment enables the operator to pinpoint the fault within a few centimetres, keeping excavation costs to a minimum.
A signal entering the ground is detected through the A-Frame spikes (ACVG) and amplified by the receiver electronics. An arrow on the display points to the direction of the fault, enabling quick and easy pinpointing as detailed in Figure 3 below.

Figure 3: A-Frame used to pin-point coating defect
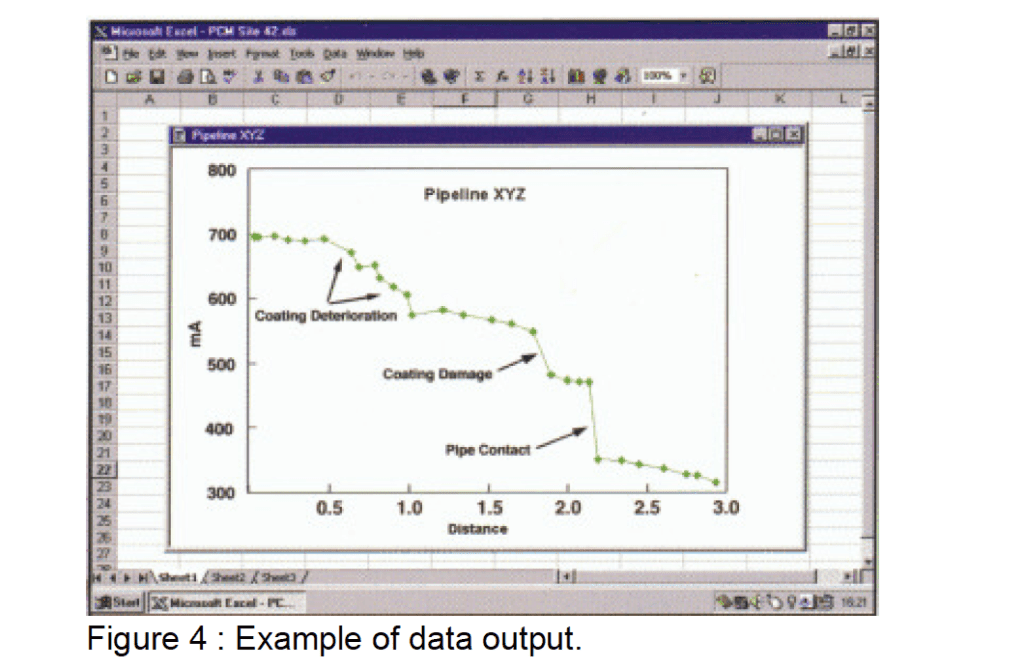
The PCM is provided with a simple-to-operate, Windows-based upload software package. The “Icon” operated software enables the uploading of PCM data and automatic conversion to text format. This is compatible with commercially available spreadsheet software packages. A typical example relating to the pipe graphics is illustrated below in Figure 4.

Figure 4: Example of data output.
4. Pipeline Current Mapping Survey: Methodology
The PCM surveying methodology is detailed below :
- The PCM transmitter (PCM Tx) is set up as follows. Connect the output leads as follows: WHITE to pipeline and GREEN to anode ground bed.
- Select Mapping frequency: ELF was selected to ensure that the current and direction can be mapped.
- Connect the PCM Tx to the battery or AC power source.
- Switch on the PCM Tx transmitter.
- Set the current output level.
- Slide on and connect the PCM Magnetometer foot
- Check the Battery level and replace it if necessary.
- Set to the same mapping frequency as the transmitter.
- Set to Peak mode.
- Good local knowledge, a map and a notepad are essential to obtaining the correct information.
- Locate the pipeline and move at least 15m from the transmitter.
- Use the receiver and verify that the PEAK and NULL positions are within 15 cm
- Obtain in-depth reading. A sensible reading indicates a site free from interference.
- Press the mapping key to obtain the PCM current reading. Press the key to save the result, and note the log number on the notepad and map.
- Use the GPS to select the next mapping location or continue along the pipeline for a predetermined distance. 50 – 100m is adequate.
- Select Null mode and trace the pipeline to the next mapping location.
- Repeat procedures 1 – 6 until the pipeline survey is complete.
- Use Accessory A-Frame (ACVG) to pinpoint the fault.
- Upload results to PC, and prepare a graph of current against distance.
- Categorise areas for excavation and repair (if required).
5. Interpretation of PCM Site Data
The AC signal current applied to a coated pipeline in perfect condition will be lost by capacitance as distance increases from the point where the signal is applied. The resulting graph drawn using A/mA will have an exponential slope because there is a greater current loss rate close to the transmitter.
The PCM uses a near DC signal (4Hz) for current measurement, so capacitative losses are minimal.
Example: There was a coated pipeline with three defects of equal electrical resistance: one near the beginning, the next in the middle and one at the end. If the current loss graph is prepared using mA on the vertical scale, the second and third faults would be shown as progressively smaller steps in the graph. This is due to Ohm’s law and the loss of current at the previous fault.

 To all knowledge